Table of contents
Summary
TO TOLL OR NOT TO TOLL ? THAT IS THE QUESTION
RECENT OBSERVATIONS AND THEIR INTERPRETATION
A/
B/
C/
D/
E/
F/
APPLICATION OF THE ECONOMIC THEORY AND CALCULATION OF BITTERNESS TO FUTURE PROJECTS
Conclusion
By VINCENT PIRON
Engineer at the Ponts et Chaussées-Group VINCI-Director of concessions strategy
The recent redevelopment of transportation infrastructure project finance, and of public/private partnership co-operation has provided a substantial amount of information, on a scale that major economists such as J. Dupuis and M.Allais hardly dared dream of! This information, under scrutiny, highlights a notion symmetrical to that of surplus, which is known as bitterness and is described in Transports No. 402. In the light of a detailed analysis of five recent infrastructure projects, the present article shows that the notion of bitterness should make a practical contribution to the foundation of a logical approach to charging decisions, and so reduce lack of precision in revenue forecasting. J. Dupuis’s concept of economic surplus, when supplemented by the political analysis of bitterness and combined with a realistic estimate of real discount rates, gives a rational key to the decision-making process implemented by the authorities in the transport infrastructure field, and to the decisions on risk-taking made by private enterprise.
I. TO TOLL OR NOT TO TOLL ? THAT IS THE QUESTION.
The present article supplements the thinking of Claude Abraham, who raised issue in a rigorous manner, in terms of a comparison between various behavioural laws. He developed the notion of “bitterness” within an economic framework, and set it out in a seminar organised by the urban community of Lyon and by the LET. This seminar dealt with the north toll by- pass round the city. This article also supplements a study on the political acceptability of tolls published in the Transport Revue, No. 402 July-August 2000, in which we assessed various optimums (for the local community, for the licensed operator of the infrastructure and for drivers) as a function of toll charges.
In December 2000, at the Lyon seminar, the speakers mainly concentrated on the financial, legal and administrative aspects of the by-pass project, but did not really deal with the question of economic rates of return on investment in infrastructure, nor exhaustively deal with the question of alternative modes of finance.
What advantage is there in placing a toll on a road infrastructure, as compared to the classic approach of building and maintaining these facilities from public funds? The urban community at Lyon will need to solve this problem, if the western by-pass the city is to be successfully completed. Doctrinal positions, which make little contribution to resolve actual problems, will need to be avoided.
The response to this question requires a knowledge of several elements: • The law of demand as a function of disutility (generalised cost)1
1 Disutility is the sum of the cost of time, of the cost of use of the vehicle and the toll expense
1
Political reaction of the residents and the manner in which that the action is interpreted by decision-makers
The surplus generated by the construction of the infrastructure.
The magnitude of the difference between the discount rate applied to public and privately sourced funds.
II-RECENT OBSERVATIONS AND THEIR INTERPRETATION
The notion of bitterness was devised to account for a magnitude which is not strictly economic but behavioural. It refers to complex and twin level psychological considerations. The first level is that of the tax-paying driver, who is not the customer paying for the service provided by the toll infrastructure. The second level is the toll road’s image in the mind of decision-makers. At issue here is the interpretation of the situation in the minds of decision- makers working in the charging field (generally speaking politicians) at a given time, on the basis of what they believe will be the attitudes of tax payers who are not direct customers paying of the use of the facility, and whether or not the are car drivers. For purposes of simplification and to ensure consistency with the previous Transport article, we shall refer to those drivers who are not paying customers of the facility as the ‘excluded’. Transportation greatly affects daily life, particularly politically. At this point, therefore, we have the dual notion of the political personalities interpreting what they believe are people’s reactions (the paying users of the facility or the excluded) and making known their opinion through the media (which does not prevent the media also making their own contribution to the forming of political decision-makers’ opinions).
The fundamental role of the media thus becomes clear. The media are the direct amplifier of the initial reactions of the initial paying users or initial excluded of a new toll road or facility. If the communication campaign at the time a toll infrastructure is opened is a success, and all the necessary explanations given, the media fall-out when the new facility opens will be minimum. If this is not the case, the situation can get out of control.
The feelings of the excluded, in regard to the toll infrastructure probably are:
regret at not having sufficient income to pay for travelling on the toll road
jealousy regarding others who are in a position to pay
the impression that part of the work has already been financed by the general taxation
levied on all members of society, while the toll charges are high enough to exclude those people not rich enough to pay for and enjoy the new road. In so many words, the excluded feel towards the new road as if it were a form of misdirected taxation: money was taken by taxation out of the pockets of the ‘have nots’ and given to the ‘haves’.
Finally, it must be said that the concept of the excluded should be handled with caution. The notion should not be applied indiscriminately to a particular travelling individual. A person may use a toll road occasionally when in a hurry (willingness to pay for a particular journey at a particular time, and pay a toll whose amount is acceptable to that person). But does the person who does not regularly use the road fall into the category of excluded?
It could be said that, to oversimplify the interpretation of the model, that if a “low income person in a hurry” has more willingness to expend income on the toll, that driver exhibits a
2
behaviour characteristic of those with high disposable income, more so than high-income persons who don’t care about time and have no wish to pay. The difference is that the poor person’s actual disposable income is too limited to pay, except occasionally. Thus the concept of the excluded is not simply a matter of social segregation. Excluded from toll motorway use are the types of travel for which the road offers very low value added. The persons themselves are not excluded from the sociological point of view, which is not to say that persons with low levels of disposable income will not exhibit travel patterns more characteristic of the excluded, than a person enjoying high disposable income or a person who is regularly reimbursed for his or her toll expenditure.
2.1 Methodology
2.1.1. Elasticity
The road planners’ dream would be to know the law of demand plotted against the cost of the journey. We have therefore attempted to strictly apply the law of demand and Jules Dupuis’s theory to toll roads. When investigating the law of demand, one way forward is to examine the change in the quantity of travel at times of general change in the cost (or in disutility) for journeys taking place in a given and known corridor. Concretely, this means that there are two experimental points on the demand curve. These are the generalised cost and the initial traffic volume for the first point, followed by the new generalised cost and traffic after changes in pricing or the opening of a new facility (and hence travel option) which increases capacity and reduces the generalised cost. It is therefore possible to calculate elasticity between the two points.
However, the two points do not define the curve. We therefore made an assumption involving considerable simplification, which was that the elasticity (e) was constant.
That being the case, the matter becomes simple. The equation ε =(dy/y)/(dx/x)= constant is easy to integrate and provides the following demand curve :
a
y = ———
x- ε
This family of curves depends on two parameters, a and e, determined at the two points of measurement. Interpolation and extrapolation of this curve is then possible, within reasonable limits.
2.1.2. Conditions of application of method.
2.1.2.1 Use of demand curve.
From the two measurement points, the demand curve was established. Of course, there was no question of extrapolating beyond the bounds of a reasonable scope of validity, whether for excessively high or low disutility. In practice, the shape of the city and the way its urban transport operates will be a determining factor for the disutility of transportation, and if the disutility in a given corridor is excessive, the city will develop in another direction. We have arbitrarily cut off the curve at a disutility level three times the observed disutility prior to the
3
road going into service. This decision is equivalent to limiting the initial surplus arising from the existing roads to an arbitrary level. The values for the surplus then need to be interpreted in absolute and not relative terms, that is as a difference compared to a reference level, i.e. as a percentage increase in the surplus.
Similarly, for the purposes of extrapolation, we have never gone beyond the nil charge zone, as these other factors in travel cost fall outside the scope of infrastructure pricing policy.
To demonstrate this, in operational terms, the cases presented are taken from real life, and some are subject of on-going discussion at the time of writing. We therefore present four levels of disutility:
the first prior to the road going into service
the second with initial pricing for the road
the third is the alternative pricing actually applied in Lyon, and elsewhere the
theoretical pricing
the fourth when the road is made free of charge.
In each case we calculate the classic economic magnitude (surplus) and the political image (bitterness).
2.1.2.2 In order to estimate willingness to pay, the great variety of individual behaviours has been simplified into to an average value.
The method that we have used is extremely simple and can be broadly applied to all cases. Everything said in previous articles (Transports Nos. 377, 379, 385 and 402) on the dispersion of people’s feelings towards tolls, and on the traffic distribution laws as a function of the generalised cost of journeys, remains true, but we have had to simplify the issues. We shall take into account, for willingness to pay by time unit, only the final average value arising from an equilibrium which is assumed to be perfect, of very many instantaneous individual choices. We have also assumed that all the journeys (free of charge or toll) involved in the corridor under study had the same generalised cost. The theoretical equilibrium is determined by traffic models.
The “willingness to pay” factor draws on the results of the various studies made on an a posteriori basis, to understand the traffic levels observable in Lyon (toll 2), in Marseille (Prado-Carenage tunnel), in Lisbon (on the Tagus bridges) and over the Prince Edward island bridge in Canada. Willingness is quantified at FRF 50 an hour in Lyon and Marseille, FRF 40 an hour in Lisbon and FRF 90 an hour in Canada, the latter price being a reflection both of higher purchasing power in Canada relative to France, and above all of the fact that frequent and short distance urban journeys have a considerably lower willingness to pay than long distance journeys.
2.1.2.3. The variety of travel patterns has been simplified into an average journey.
For the purposes of simplification, the calculation we use applies to an average journey representative of the use of the corridor under study. The determination of this average journey depends on a good knowledge of the way the local area operates, or the region if the road is inter-city. If the origin/destination matrices are correctly designed, this average journey is precisely the barycentric mean of all of the journeys in the given area.
4
We took into account general growth in demand between the benchmark years for the measurements, assuming a growth coefficient of 2% a year between 1996 and 2000.
2.1.2.4. Rigorous estimate of speed
One of the essential points in the assessment of disutility is how to take into account time spent (or wasted?) in travel, which means the speed of traffic on the toll roads and on the additional, adjacent or connecting roads, depending on the point of view adopted. To be as close as possible to reality, we measured travel time and hence the speed of the journeys studied. These observations of reality, and not theoretical results of a traffic model, provided us with the basic calculation.
The great sensitivity of economic calculations to real speeds of travel is well known. For a door to door journey in an urban area in a car, speeds vary between 15 km/h and 35km/h. The operational speed of public transport varies between 14 km/h and 30 km/h depending on distances.
We paid particular attention to this parameter, and urban analysis supplemented the transportation analysis.
2.1.2.5. No specific account taken of degree of obligation.
We assumed that the various journeys in the corridor studied were balanced (identical disutility). Charging was made mandatory by political decision-makers (the price being lower as the degree of obligation is higher). Charging is included in the calculation of disutility.
2.1.2.6. Build-up
After the period of build-up was over in the case of initial charging for the north by-pass road around Lyon, we took into consideration traffic at a considerably higher level than at the time of the cancellation of the private concession contract.
2.1.2.7. No specific account taken of frequency
The frequency of a journey is an essential parameter if there is to be an assessment of drivers’ willingness to pay. However, frequency could not be given specific treatment, and appears in the law of demand. If the generalised cost (or disutility) reduces, traffic will increase: the same people will travel more frequently. For example, reduced “season fare” prices are naturally expressed in the model as journeys of lower disutility.
2.2. The results
We shall examine the results obtained in five corridors. Two in Lyon are on the same road, but do not have the same functionality, and are therefore analysed separately.
The Marseille infrastructure is the Prado-Carenage tunnel connecting two other motorways and passing under the hill in the town centre. It plays a mixed urban and transit role. In Lyon, the north by-pass has been branded the TEO. The purpose of its western portion is the urban regeneration of the Vaise district, by taking Vaise through traffic out of rue Marietton, and
5
doubling up the Croix Rousse tunnel to achieve a dense flow east-west connection. The purpose of the eastern part of the by-pass is to reduce traffic on the left bank of the Rhône by diverting it to the right bank, where the general quality of urban development is poorer, doing so from the Croix Luizet exchange combined with the completion of the east-west connection facility mentioned above.
The bridges over the Tagus in Lisbon play a mixed urban and transit role. The old bridge was primarily used for urban travel, connecting former working class districts, which are now more diversified socially, to Lisbon city centre. The new bridge, where crossing tolls are higher, carries customers who are far more transit-oriented. Both bridges are dealt with as single corridor.
Finally, a recent infrastructure in Canada is highly significant. This is the Prince Edward Island bridge which replaced a ferry in 1997, and for which data have been continuously available from some considerable time prior to its opening. This facility is used only for inter- city travel.
2.2.1. Marseille
The Prado-Carenage tunnel is text book case study of simplicity and success. This does not mean that its construction and completion were an easy matter for the various parties involved from the earliest times in its history. However the conception of the infrastructure, and its construction, completion and tolls, show a good match to the city development plan and to the initial purpose of the tunnel.
2.2.1.1. The demand curve
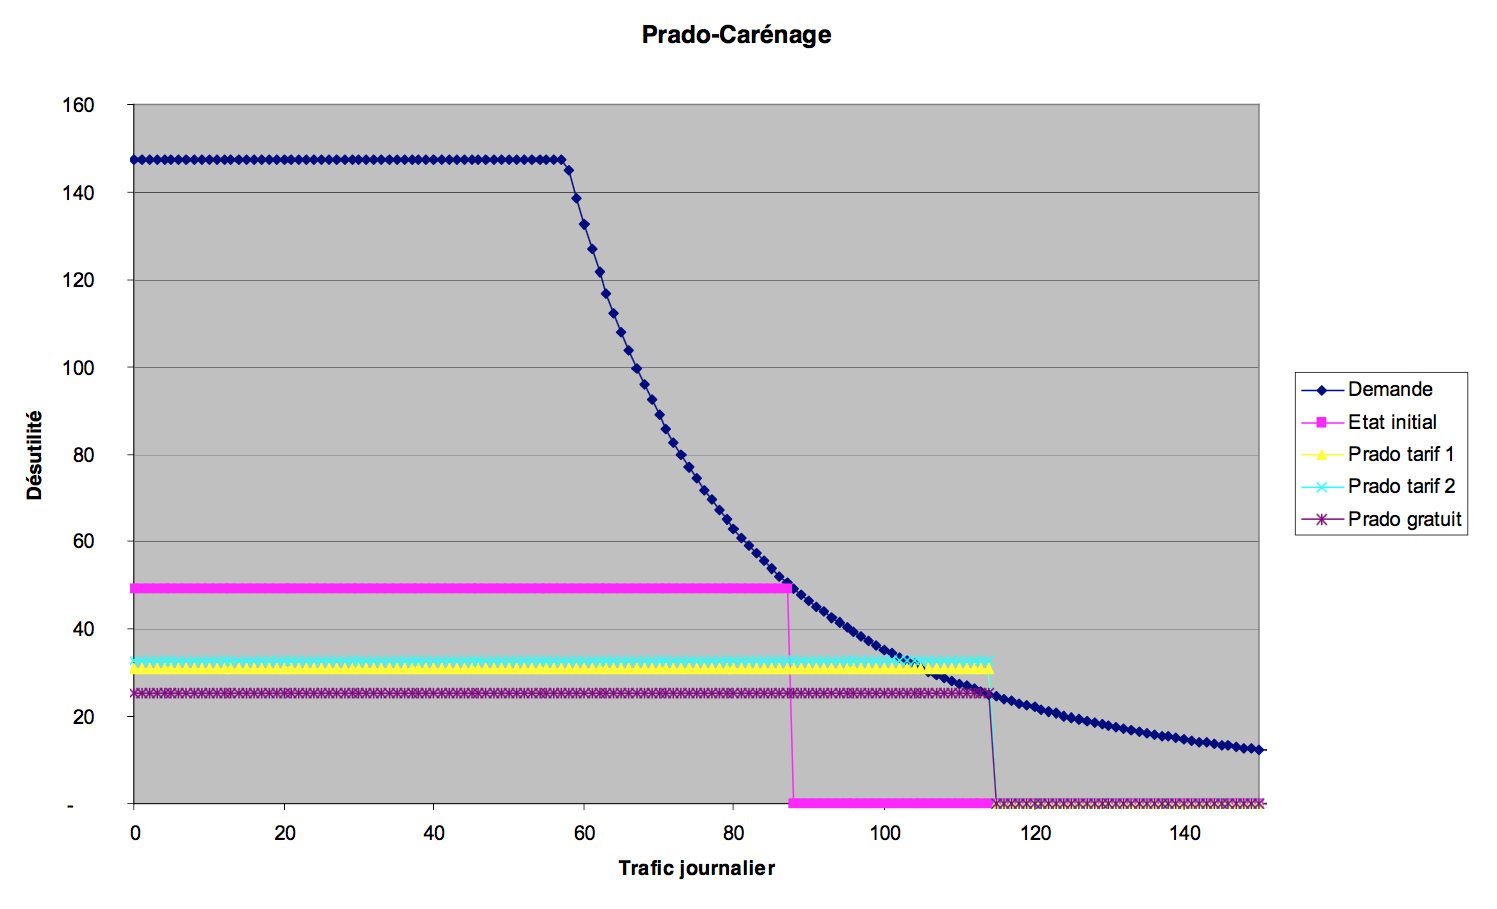
The graph shows initial disutility of around FRF 49, with the corridor traffic taking 88,000 vehicles a day. After the tunnel was opened, and after a period of build-up, and at present day tolls, traffic in the corridor can reach 105,000 vehicles a day. Of these 105,000 vehicles nearly 38,000 use the toll tunnel. This shows firstly that the traffic in the adjacent roads has been reduced by 21,000 vehicles a day, and secondly that the traffic induced into the corridor by the opening of the tunnel rose by around 19%. As this is mainly short distance traffic, the whole way of life of the urban districts close to the end of the tunnel has been changed. The Euromediterranean development and the renovation of the district around the station has benefited from the tunnel, as well as the southern urban district, where activity density (population plus jobs by hectare) is increasing.
Disutility of travel has fallen from FRF 49 to FRF 31. The elasticity as calculated is therefore 0.5.
Also we note that an increase in price of FRF 2 would have had no effect on the disutility of travel. The tunnel would be a little more fluid, but more expensive, whereas the road itself would carry less traffic, and consequently become more expensive in terms of construction costs relative to traffic volume. Disutility at equilibrium can therefore be assumed to have been growing at a slower rate than the toll charges.
Making the tunnel free of charge would not change a great deal for the traffic in the corridor. If the extrapolation of the demand curve is to be believed, overall traffic would increase by no more than 8,000 vehicles a day. In practice, the complexity of the road network and the saturation of certain sections might even render the free of charge option non-viable.
2.2.1.2. Economic assessment
On the basis of the assumptions presented above in § 2.1, the calculation shows that the initial surplus is in the order of FRF 1,494 million a year. We repeat that this surplus has been conventionally calculated, and that its absolute value is difficult to interpret. The surplus due to the opening of the Prado-Carenage tunnel with its present day toll charges is around FRF 380 million a year, and the corresponding bitterness FRF 7 million a year. Bitterness grew at a far slower rate than surplus.
If the price is slightly increased, from an average of FRF 13 per one way trip to FRF 15, of course there is a reduction in the collective surplus, from FRF 380 million to FRF 343 million, and growth of bitterness from FRF 7 million francs to FRF 11 million. The simple subtraction of bitterness from the economic surplus shows that the balance falls by approximately 10%, from FRF 373 million francs initially to FRF 333 million.
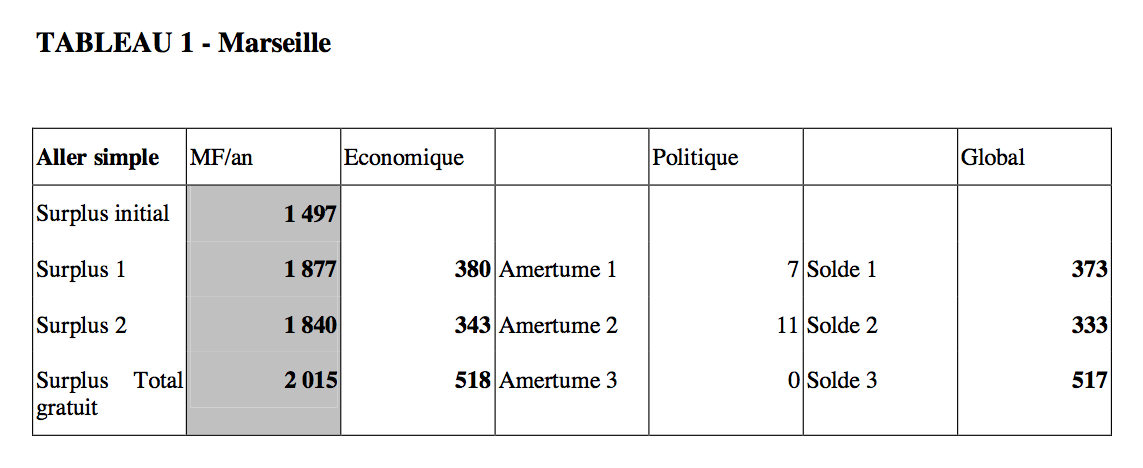
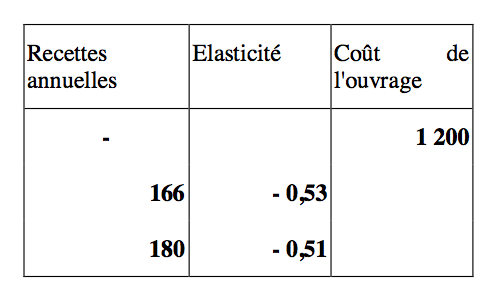
The revenues of the licensed operator would increase from FRF 166 million francs to FRF 180 million, which is, proportionally, a far higher growth. The classic result, set out in detail in my previous article in Transport No. 402, is found here again, namely that the optimum for the licensed operator is not the optimum for the collective interest, and that the level of toll charges should reflect a balance between the imperatives of travellers and of transportation policy more generally on the one hand, and the imperatives of the financiers on the other. Note that with tolls at FRF 13 francs, the licensed operator’s revenues were less than half the overall surplus, but that when tolls rise to FRF 15, the operator’s revenues rise to over half the surplus.
At the time of writing, the introduction of a new V.A.T. regime on 01/01/01 had not substantially changed behaviour in the context of travel for work-related reasons, although disutility had fallen.
After allowance for the cost of the tunnel, inclusive of financial charges, the annual revenues generated, at FRF 166 million, were enough to cover operating expenses and repay the debt, while leaving a small rate of return on the capital initially provided by the shareholders. It should also be said that the community paid for and financed both road access to and the excavation of the first tunnel, which was sold on to the licensed operator for a price less than its construction costs as built from scratch.
It can be said that the toll link in the chain (Prado-Carenage tunnel) forms part of the interlinking of highway facilities (motorways at the ends + tunnel at the old port + Prado- Carenage tunnel + interchanges), whose costs are double those of the toll tunnel itself, and that the whole system operates harmoniously. Income from the toll charges only on the tunnel would never have been enough to finance the whole interconnected system, although it does cover some 40%.
2.2.2. LyonMarietton
The case of the northern bypass around the Lyon conurbation is complex in analytical terms, as it is made up op a succession of infrastructures whose purposes are not identical, given that there are numerous entry and exit points. The west portions (Duchère tunnel and Caluire tunnel) have as their main purpose creating access between the western zone and the city centre, so reducing or eliminating transit traffic through the Croix Rousse tunnel and in Rue Marietton, and allowing for the completion of urban renovation in the Vaise district. The logic is simple, and the toll charges are currently set at such a level as to enable the west part of the road system the play its relief role.
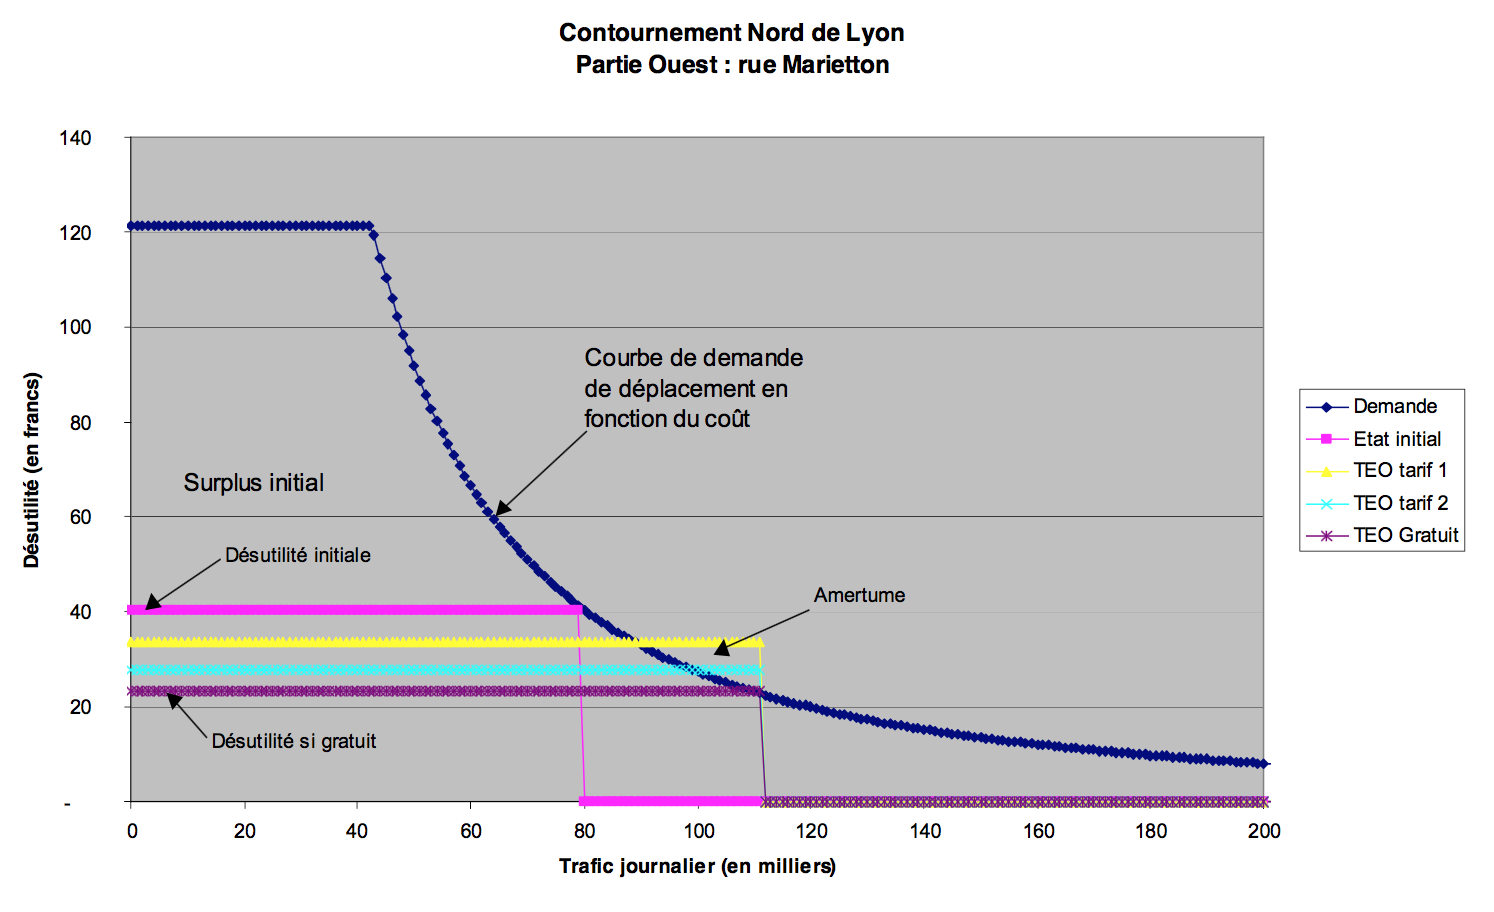
It is fairly difficult to define a corridor in a relatively densely meshed area. But the existence of the Croix Rousse tunnel is a virtually compulsory itinerary for people living in the west when they want to drive to the city centre or to the other side of the city. We therefore consider that the corridor made up of the Croix Rousse tunnel and of the northern bypass (Caluire tunnel) as a corridor, initially taking 80,000 vehicles a day and building up, now, to around 89,000. However, it has never been an easy drive for those taking it.
The initial disutility could be estimated at around FRF 40, largely due to lower speed at peak hours in the morning and in the evening. At the time the relief road was opened, the combination of the new speeds and the tariff reduced disutility by FRF 6 approximately to FRF 34, a decline of 15%. This is small, but matches the assumedly optimised results proposed by the traffic models at present in use. The drivers appreciated it clearly, especially as the distance travelled was short and the time savings in absolute value low.
Traffic in the corridors was never the less thought to be increased by 9,000 vehicles to 89,000 vehicles a day, 18,000 of them using the toll infrastructure, accompanied by a decline of 9,000 a day in the Croix Rousse tunnel. This is less than had been thought after the studies made soon after the opening, but after the change in toll changes, to take into account the potential build-up.
After changes in contracts and charges, in part due to driver discontent, the daily traffic observed is now 100,000 vehicles, breaking down to 48,000 taking the toll relief road and 52,000 using the Croix Rousse tunnel. By comparison with the initial pricing system, journey disutility has considerably fallen, from FRF 34 to FRF 27.7. By comparison with initial disutility, the fall is by FRF 12.3 from FRF 40, or by 30% . For somebody living in Tassin making about 50 fifty journeys a month, the gain in FRF 635, around FRF 7000 a year.
Let us now assume complete elimination of the toll, now the standard demand of a number of associations. Disutility would fall to about FRF 23, on the assumption that access capacity was adequate, which is by no means the case. By extrapolating the demand curve using the FRF 23 disutility figure, traffic in the corridor would rise to 110,000 vehicles a day, or only 11% more than with today’s toll. In other words, from the traffic point of view, making no charge for the relief road would not make a great deal of difference as compared to the present situation.
The Croix Rousse tunnel traffic has fallen very substantially from 80,000 to 55,000. Fluidity has considerably increased and adjacent roads are no longer full of transit traffic taking “short cuts” at the expense of the road systems and life styles in this community.
2.2.2.2. Economic assessment
In terms of final economic assessment, the infrastructure has performed well, although this was not the case from the outset. The conventional initial surplus was FRF 951 million, the surplus at the time of the initial toll charging being FRF 1071 million, or only FRF 123 million more. Bitterness on the other hand was considerable, as it reached the negative figure of FRF 28 million, bringing the overall balance to a figure of FRF 93 million, which is only marginally positive.
The second toll charging system substantially changed the economic equation. Surplus reached FRF 1,187 million, a gain of FRF 236 million compared to the initial system, and the bitterness figure was diminished by a factor of four. The final positive outcome is FRF 230 million.
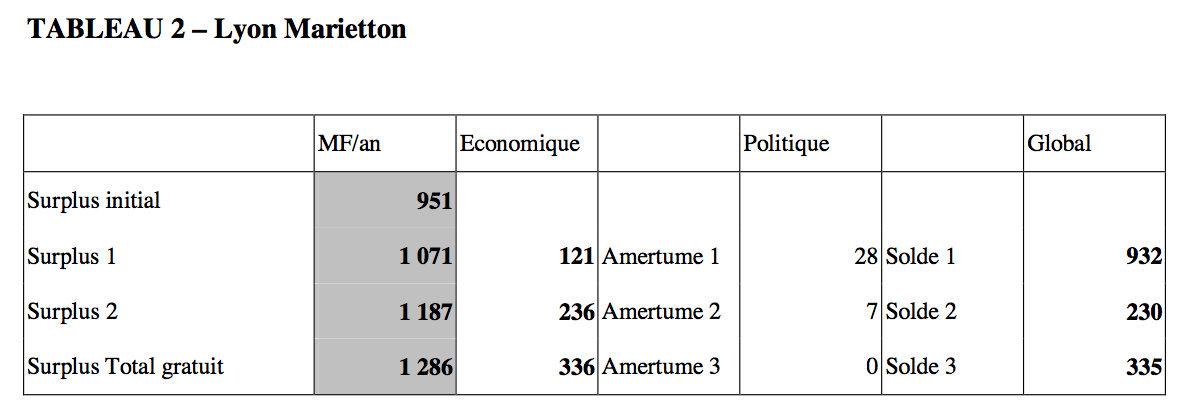
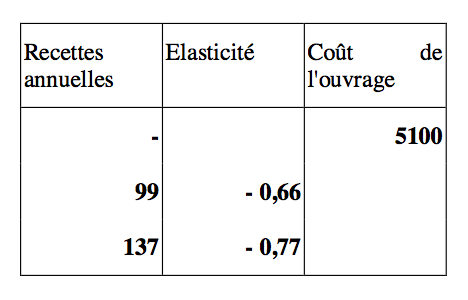
Zero charging would increase the economic gain by FRF 100 million as compared to the present pricing system, but would reduce revenues by FRF 137 million.
Of course these figures take no account of the benefits in terms of the urban community, due to reduction in noise, pollution and traffic from outside the Vaise and Lyon 6th district. This benefit has been estimated, from the rising prices of apartments, at a strict minimum of FRF 700 million all in all (not only per year but once and for all).
Elasticity is around 0.7. Revenues are greater with lower charges, but the gross operating surplus (revenues after subtraction of operating expenses) is no more than FRF 80 million and offsets only 22% approximately of the cost of the infrastructure. This is a standard value, which is repeatedly found in other case studies.
2.2.3. Lyon Croix Luizet
The east part of the northern bypass at Lyon is very different from the west. Here it was intended to improve the exhibition centre environment, by transferring to the right bank of the Rhône the transit traffic which previously used the Croix Rousse tunnel, and transferring at the same time the traffic headed for Lyon town centre and Villeurbanne. For this, the capacity of the existing roads was reduced, and drivers were forced first through a pay toll and to suffer a longer journey. This obligation fell not on the higher income areas of the city, but the lower income districts where willingness to pay is the lowest. Public reactions to the toll were highly negative and for various reasons, the political decision was taken to act rapidly out of a willingness to take into account the initial reactions of rejection more than actually necessary.
The toll on the journey to the city centre was lifted, but the toll on transit traffic out of the Caluire tunnel to onward directions was kept. The demand curve on transit traffic remains as stated in the previous paragraph. The curve below shows demand relating to traffic headed for the city centre.
2.2.3.1. Demand curve
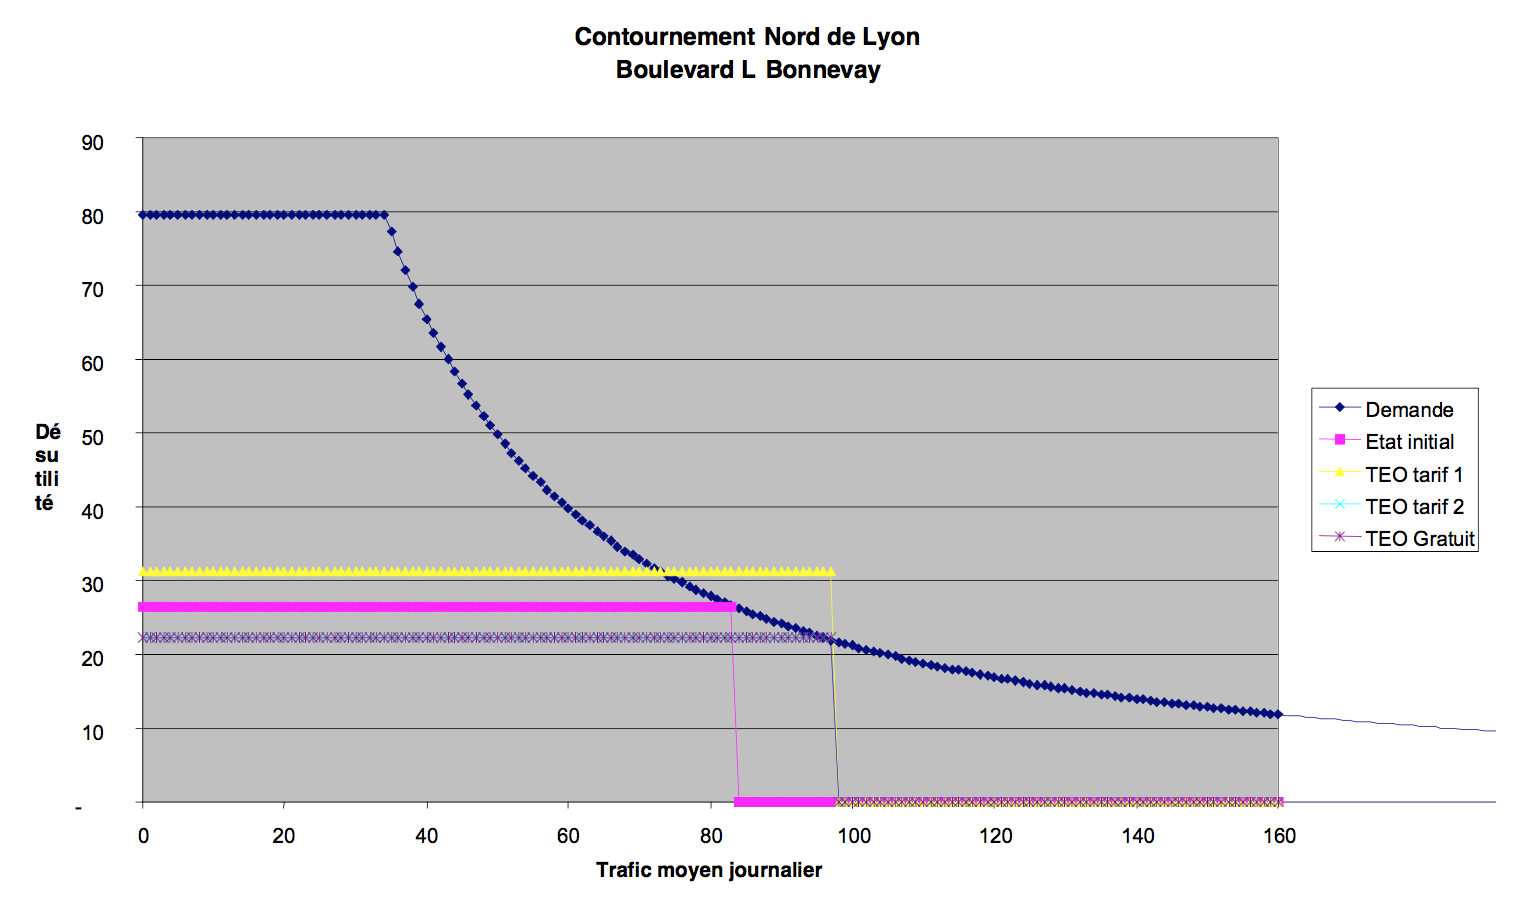
Initially, traffic from the eastern part of Lyon mainly used the Laurent Bonnevay boulevard on the left bank of the Rhône and a network of low capacity roads in Villeurbanne, giving disutility of approximately FRF 27 million and traffic up to 83,000 vehicles/day in the corridor, the major part being on the L.Bonnevay boulevard. Along with the construction of the north bypass there was a reduction in capacity in the existing toll free roads, which increased disutility to nearly FRF 31. Consequently traffic was reduced by 10,000 vehicles a day, and was displaced onto other roads in the conurbation.
The lifting of the toll reduced disutility to FRF 23, and traffic returned, massively switching over to the new itinerary, whose traffic rose from 8,000 to 60,000 vehicles a day. The intended result at the time of the decision to build this circular bypass was achieved, and residual traffic on the left bank fell to no more than approximately 38,000 vehicles.
This illustrates the immense danger of improper use of traffic models. The O/D matrix and corresponding data processing software making it a requirement for traffic to use either reduced capacity and reduced speed roads or the toll road led to an optimum toll level which was far to high, and bore no relation to the demand curve or to the political stresses arising from the resulting compulsory use of the road facility. The flexibility of journeys and of the time slots for highest demand were far greater than shown in the model. The level of expected revenues was consequently over-estimated by a factor of 10.
2.2.3.2. Economic assessment
The final economic outcome of the north Lyon bypass was positive, in spite of a initial error in toll setting and also failure to take the opportunity to maintain the toll at the connection between the left bank and the Dombes plateau, which could have brought in around FRF 25 million annually to the urban community. The error in initial design is clearly identified if the notion of bitterness is brought into play.
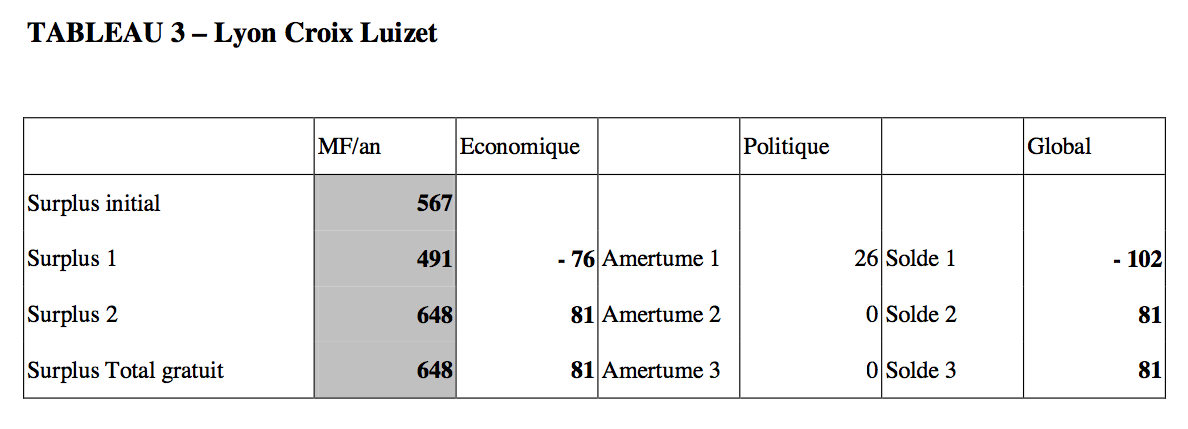
From the strict point of view of transportation policy, the economic assessment of the initial charging structure was substantially negative (- FRF 76 million a year), although this is not shockingly unacceptable, insofar as the purpose pursued was not improvement in transportation but in the quality of urban life in this area. On the other hand, by adding in FRF 6 million bitterness, the negative figure is increased to FRF 102 million a year, which is an excessively high cost if borne mainly by the people of the eastern part of the conurbation, in regard to what was no more than an improvement in the amenities on the left bank between Croix Luizet and the Palais des Congrès.
The removal of the toll as a result of discontent shifted the transportation outcome to a positive of FRF 81 million, an improvement of FRF 200 million.
The annual revenues, which should have been FRF 53 million under the initial regime were reduced. Elasticity remains around 0.7 and a little greater if a step is taken in the direction of reduction of disutility. The potential revenues increase or decrease is marginal as compared to the cost of the infrastructure, but this is only to be expected, as the gains obtained are specifically in terms of town planning and unconnected with the transportation field.
2.2.4. Lisbon
The crossing of the Tagus is the last urban example in our article. Lisbon is a conurbation of 2.5 million inhabitants, of which 1.9 million live on the right bank and 0.6 million on the left bank. The first bridge was built in 1966 mainly to serve the industrial area which was then fast expanding (dockyards, steel-making, automobile industry). A second bridge to cope with the saturation of the first, was built in 1998, at a time when a new business and industrial area was being developed to the north of the city, and when inter-city transit traffic was increasing.
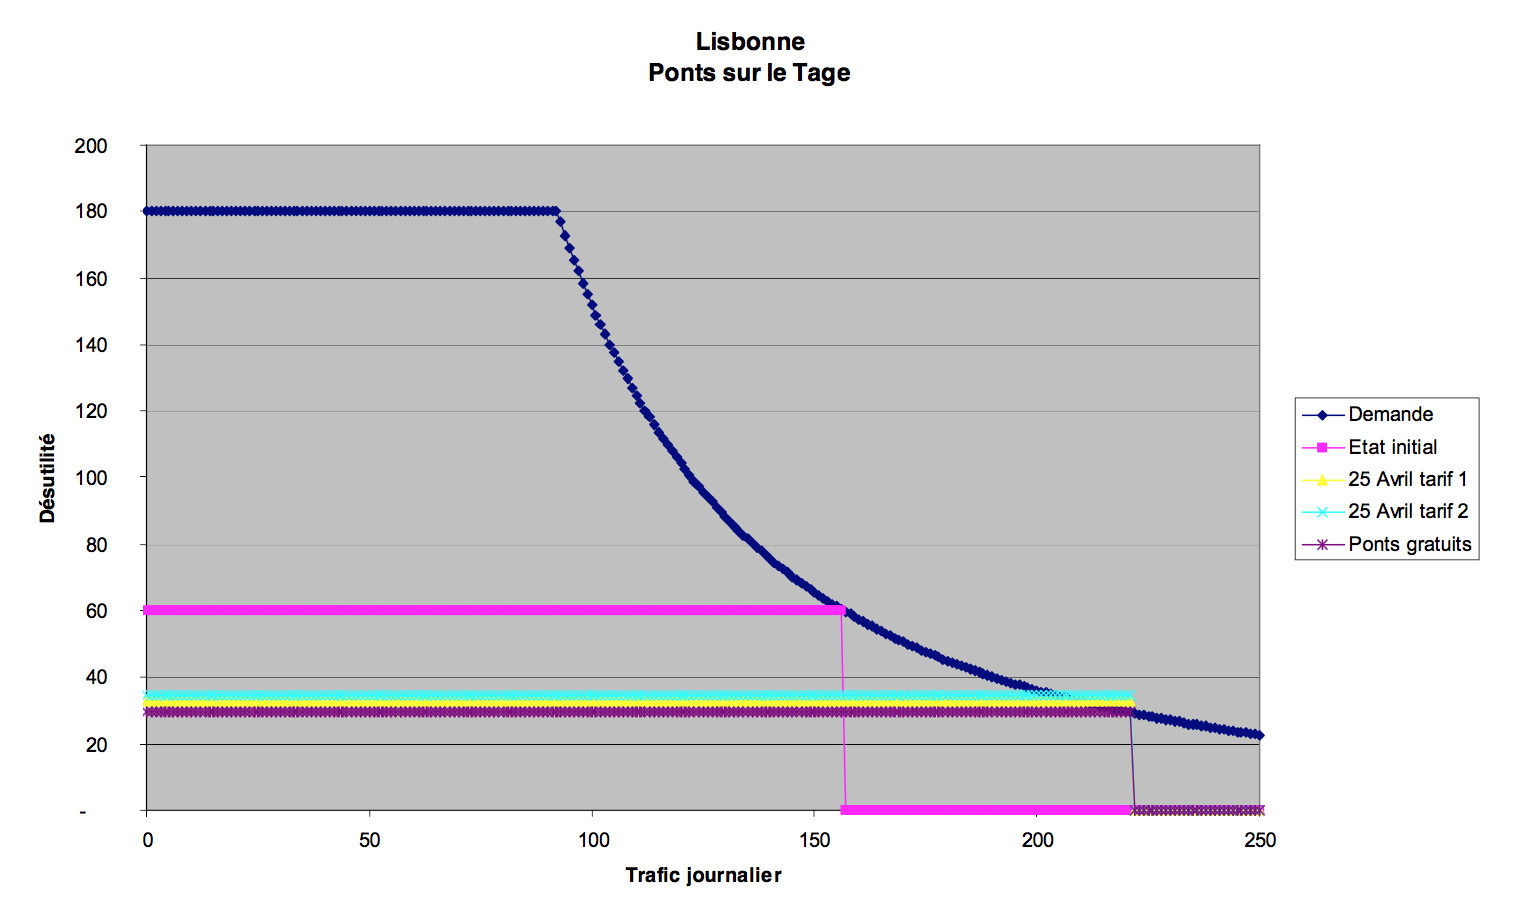
The old bridge, known as the bridge of 25 April, had two main characteristics, the first being considerable saturation (five lane capacity which was tested to its limits through traffic of 150,000 vehicles a day and with very low prices (FRF 5 for outward/return trip, or FRF 2,5 for one way). At the time of the construction of the new bridge, the old one was widened to 6 lanes and takes traffic of 155,000 vehicles a day under far better conditions. The new Vasco de Gama bridge charges users twice as much as the old, and its traffic will rapidly build up to 55,000 vehicles a day.
The corridor we have taken into consideration is the Tagus crossing as a whole, traffic being the stream of all traffic on both bridges. No account has been taken of the simultaneous opening of a public transport rail link across the Tagus, because rail is more expensive than car transportation, and because the transportation transfer occurred from bus to rail.
The extreme congestion of traffic on the old bridge reduced average speeds to 10 km/h approximately and this, combined with willingness to pay FRF 40 an hour, gave disutility of FRF 60 per trip of which FRF 2.5 for the toll. On the opening of the new bridge, and after the widening of the old bridge to 6 lanes, average speed increased substantially and disutility for the journey fell to FRF 30 on the old bridge and FRF 40 on the new bridge. The corresponding average toll rose to FRF 3.2, or only 10% of the average disutility. The overall traffic on both crossings has now reached 210,000 vehicles a day.
If the Government were to decide to put both bridge crossings on an equal price footing, and so double the charge for crossing on the old bridge, the demand curve indicates a slight drop in traffic from 155,000 vehicles/day to 148,000 vehicles/day.
If there were to be no charge on the two bridges, the increase in traffic would be approximately 10% to 229,000 vehicles/day.
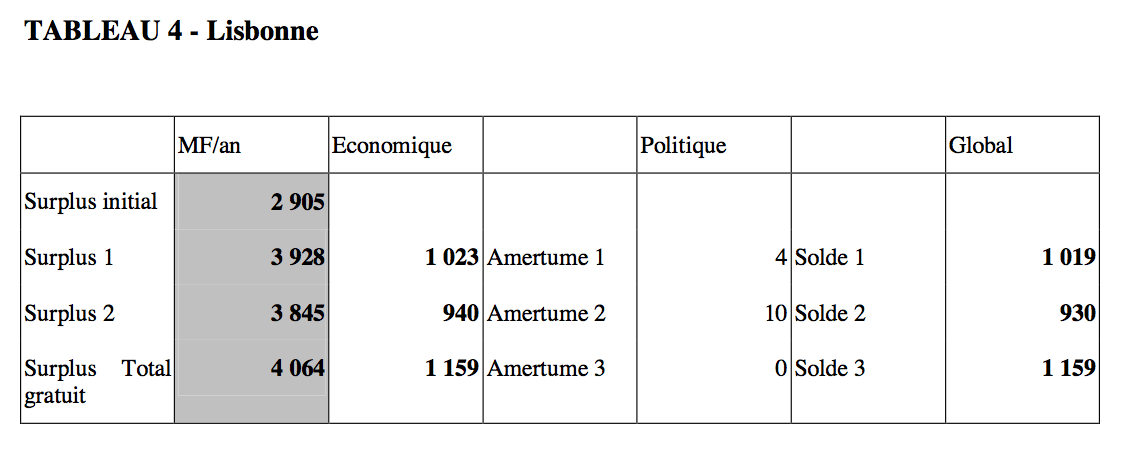
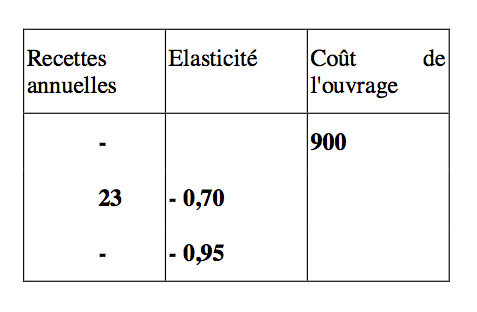
2.2.4.2. Economic assessment
Overall, the final economic assessment of the Vasco de Gama bridge construction is extremely positive. Both in terms of transportation and urban development, this project has made a major contribution to the way the town operates. The contribution in economic terms is one billion francs annually in economic terms alone, without taking into account the prospect of further development on the left bank and new construction or rehabilitation on this land.
Present charges are so low that bitterness levels are extremely low (FRF 4 million for surplus of FRF 1023 million). Doubling charges on the old bridge would double the bitterness level, but still leave an overall surplus of FRF 930 million overall, bringing the surplus down by FRF 89 million. On the other hand, revenues would considerably increase from FRF 242 million francs to FRF 372 million annually, and an increase of FRF 130 million, which if not paid for by tolls, is the charge borne by tax payers of the country as whole. With a toll charging structure, this expense would be borne by the users of the two bridges, according to a proper economic logic.
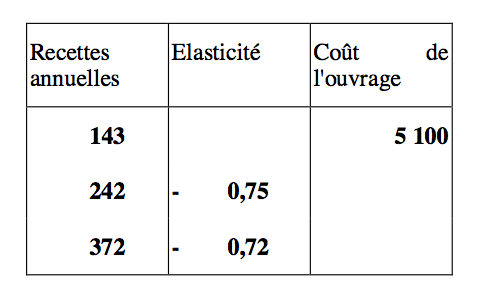
The annual revenues of the old bridge were FRF 143 million and could rise to FRF 370 million, possibly even more (FRF 400 million) without negative political reaction if charging structures were more closely suited to customer needs. Elasticity is still in the region of 0,7.
By taking into account operating expenses, the gross operating surplus could rise to FRF 300 million, which would fund around FRF 3,300 million, or close to half of the cost of the Vasco de Gama bridge itself. The revenues specifically generated by the bridge would otherwise have covered only one quarter of this figure, or 12,5% of the cost of the infrastructure. If that has been the case, a different mode of finance would have been adopted.
2.2.5. Prince Edward Island bridge in Canada
This bridge connects Prince Edward Island, a Canadian province, to the continent. It is a federal bridge and it is not dependent on one province alone. Commissioned in 1997, it replaced a ferry which was subsidised by the federal government. In terms of function it provides for inter-city traffic, and traffic densities are low. The graph shows vehicles/month and not vehicles/day! It is therefore interesting to see whether Jules Dupuis’ theory is as applicable to infrequent and long distance journeys as it is to frequent and short urban journeys.
2.2.5.1. Demand curve
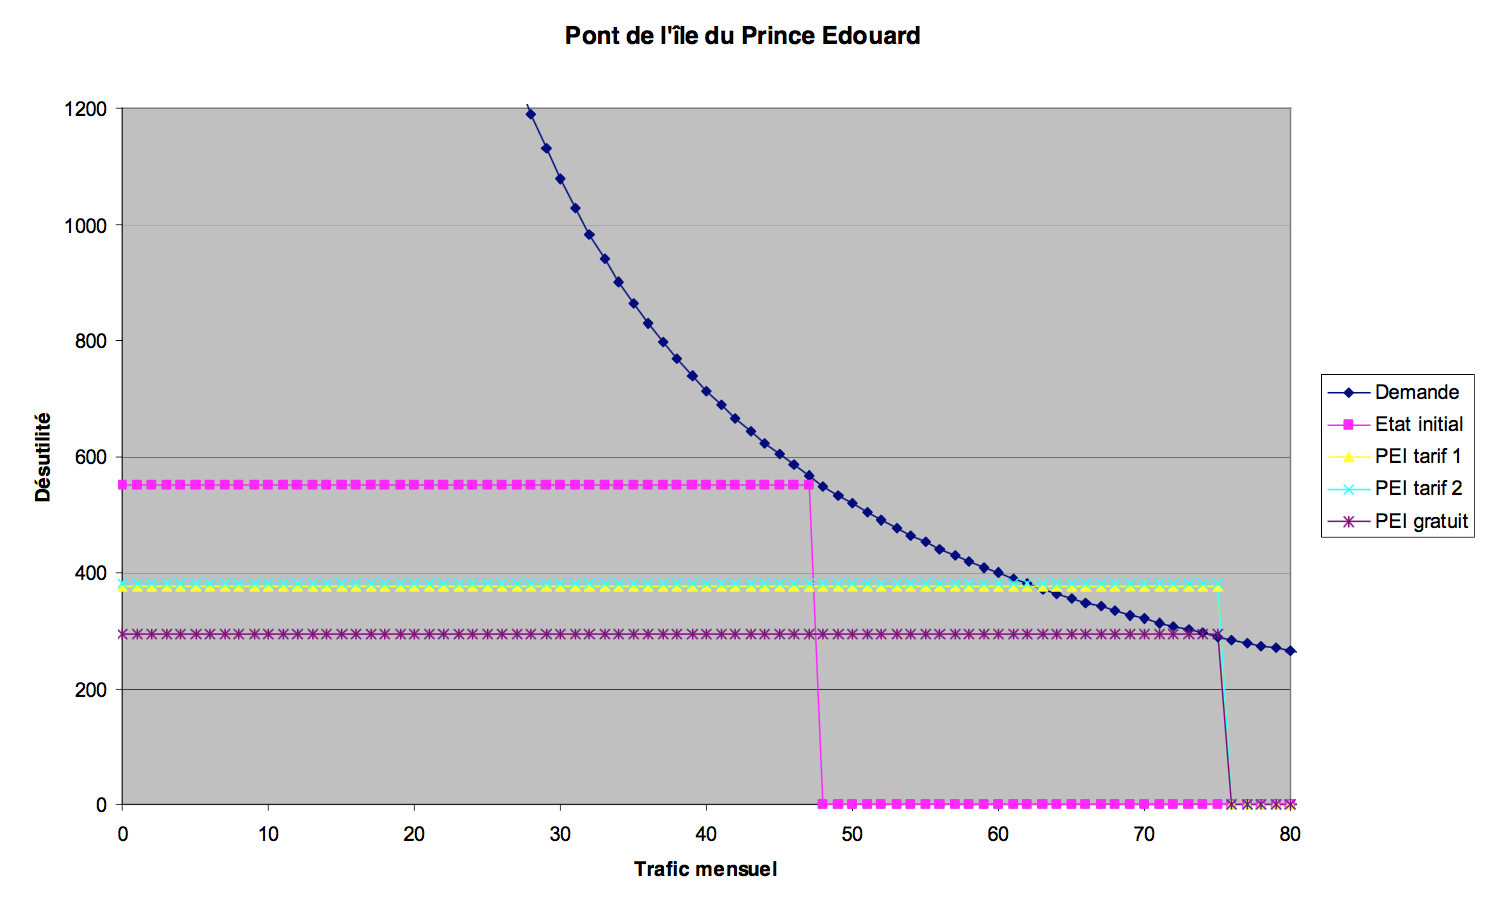
We made a day-by-day comparison of traffic over the ferry from 1996 to 2000, believing that the build-up period was over. In spite of very strong seasonality effects, translating into a difference between December and August traffic in a ratio of 1 to 5, the bridge, when it went into service showed identical elasticity, month after month. We have therefore shown in the table the average of monthly values over the years.
The average journey was taken to be equivalent to 162 km, at 90 km/h. The statistics show that heavy goods vehicle behaviour differs substantially from cars. The bridge brought about a substantial increase in private vehicle traffic (up 40 %), HGV traffic increasing by no more than 10%. This is due to the heavy goods vehicles being a priority on the ferries and their waiting time being less than cars, so that the benefits of the opening of the bridge were proportionally lower. Elasticity calculation gives a value of 1 for cars and only 0.5 for HGVs.
For private vehicles, with willingness to pay FRF 90 per hour, and in the light of uncertainty over ferry timetables, the average journey cost FRF 465 by ferry. After the construction of the bridge, this fell substantially to FRF 295, which is a combination of a fall in comparison to ferry charge of FRF 7.5 and a time reduction of one hour and 35 minutes. The toll for the ferry was FRF 75, and for crossing by bridge has fallen to FRF 67.5.
Traffic increased from 31,300 to 43,500 cars per month. In fact in the first year, traffic grew faster, as the island economy adapted to the opportunity provided by better connections with the mainland. The result was an upgrading in hotel accommodation and more retail shops of better quality than before. Consequently the hotels maximised their profits by upgrading the quality of their products while not increasing quantity. Retailers provided better management of inventory and their product offerings, and reduced their need to travel to the continent for purchasing. Hence traffic decreased substantially (by 15%) from the year of opening onwards, while remaining higher than the traffic levels achieved when the ferry was in operation. The toll price is sufficiently low , as compared to the overall cost of travel, for an increase of $CN
16
0.75 (FRF 3.5 or 5% of the toll), so reducing the traffic by no more than 500 vehicles, or 1.5% of a traffic volume.
In the light of the demand curve, the lifting of the toll would increase the traffic to 52,500 cars per day, or by 20% on existing traffic levels.
Heavy goods traffic increased by 17,300 to 19,000 trucks by month. However we dare not apply such a simple rule as that of constant elasticity to such a small sample. The economy of the island itself is the only serious guide to the forecasting of heavy goods vehicle traffic.
2.2.5.2. Economic assessment
From the point of view of federal government finances, the economic benefit is nil, and this is factored into the construction itself of the bridge. The condition set by the building of the new bridge was that government financial expenditure would remain unchanged.
From the point of view of the country’s economy overall, the final assessment is very largely positive. The values below show the total traffic, heavy goods vehicles being accounted for as equivalent to two private cars. We did not change the calculation of bitterness, but it did appear that the psychological damage from toll system was in this case almost insignificant. There already was a toll on the ferry, and now the toll charge has fallen. The multiplier should less than 1 and we shall return to this.
Surplus 1 is for the existing situation. Surplus 2 is for an increase in the toll of FRF 3.5 for a one way trip for cars and a proportional increase for the heavy goods vehicles.
The resulting elasticity calculations for average traffic (weighted traffic for one private vehicle to two HGVs), combined with the calculation of revenues, give the results below.

Here too, it can be seen that annual revenues can finance a small part only of the cost of the infrastructure.
2.3. Regarding elasticity in terms of variations of disutility
2.3.1. Value of elasticity in relation to disutility
In the few examples we have studied, the values calculated for the elasticity coefficient for cars was always between 0,5 and 0,7 for urban traffic, and 1 for inter-city traffic. It is extremely interesting to finally have results from the data base of several thousands of measurements. This provides backing to the theory, and Jules Dupuis, had he been alive, would have had the demand curve he always hoped for.
In regard to HGVs, elasticity seems to be considerably lower, and we shall return to this later in the article.
2.3.2. Value of toll elasticity
It should also be noted that elasticity is related to the total amount of disutility and not the single toll element. It could be said, to somewhat simplify, that the toll elasticity can be deduced from disutility elasticity by a multiplication of the toll disutility ratio. In the case of Prince Edward Island, the toll accounts for only 20% disutility, and toll elasticity falls very low (around 0.15). In other words, the prices could be substantially increased or decreased, and the traffic would hardly change.
In fact, the situation is a little more complicated, as the law of traffic allocation in the light of cost is also conditioned by the Gaussian distribution of wealth (see our article last year on this subject), and the elasticity itself is greater than the mere result of a multiplication.
It is at this point that the concept of bitterness has its role to play, as a corrector to pure economic calculation. Bitterness takes into account the psychological dimension which affects both drivers and decision-makers. Increased charges might have no effect in economic terms, but give rise to a bitterness such that no decision-maker could afford to ignore.
2.4. Parking an additional cost
In the above calculations, we assumed that the cost of parking was nil, or at least negligible compared to other costs. This is not exactly the case, but here again, the precise information is not available. What is sure is that the question will only arise in densely built up areas, and when parking at final destination is involved. The cost of parking from the starting point of a journey (at home) is also factored into calculations either by the personal decision not to own a car, or not to park it close to the infrastructure, or to pay money for a parking bay, irrespective of whether or not travelling.
The cost of parking at final destination is on the other hand important. Three hours of paid parking in an underground car park cost as much, if not more, than the rest. An FRF 35 journey becomes an FRF 70 one, and a return trip at FRF 70 rises to FRF 105. Quite clearly, travel policy cannot be independent of parking policy, no more than it can be of town- planning constraints, particularly in regard to the whereabouts of parking places and the parking places available in residential buildings or offices.
III. APPLICATION OF THE ECONOMIC THEORY AND CALCULATION OF BITTERNESS TO FUTURE PROJECTS.
3.1 Preliminary remarks
3.1.1. Three levels of evaluation of road transport.
It is rare that that people travel simply for the pleasure of moving. Travel is an intermediate product, and is required by actors which have an economic, emotional or leisure purpose to which value attaches, or if not for other purposes. An example will illustrate this. A family may go on holiday with an overall budget of FRF 20,000. Of the FRF 20,000, transport is a disutility of FRF 5,000 of which FRF 3,500 are monetary and FRF 1,500 time spent. Of this the charges (motorway + parking) count for FRF 500. The first level is the economic cost of the journey at FRF 20,000. The second level is the transport disutility, which costs FRF 5000, The third is the toll and other charges which are FRF 500, around 2.5 % of the cost of the first level.
In a freight market, it is conceivable to load a truck to a value of FRF 400,000, with a general journey cost of FRF 8,000, and a “toll + parking” expense of FRF 1,000.
Overall in France, a similar relationship is found at the three levels. The first level is around FRF 7,000 billion, the second FRF 800 million and the third FRF 40 million.
Clearly, a 10 % increase in tolls and other charges would not be significant as part as the final economic equation for freight users (FRF 100 out of FRF 400,000). For this reason, elasticity in regard to disutility as calculated in the second part of this article, is substantially lower for heavy goods vehicles than for cars. But the separation of the road haulage business into its different components (manufacturer, freight company and carrier) and the competition among these businesses, give greater weight to the real and psychological effects of tolls.
3.1.2. The point of view of companies and of private individuals
In many cases, there is inter-modal competition: rail against air, air against road, sometimes road against air, sea or river against air…Within a single mode, there is also competition. This is clearly the case in road and air transportation modes. In some cases there is even competition in river or rail.
The prices fixed by central governments on fuel and the subsidies given to certain transportation sectors (in particular rail), lead to a certain breakdown of transportation by mode. A change of global strategy (for example the Kyoto protocol) may lead to changes in subsidies and pricing systems which will have a knock-on effect on the modal breakdown according to the general wishes of the politicians. For example a decision to double all road tolls would affect carriers, only if their contracts were so drafted that they could not pass on the costs of the end user customers.
Things are quite different for private individuals who are end users and cannot claim back from anyone the amount they spend on their travel. If they believe they have paid “too much”, their only response is in the political field. It is this psychological phenomenon which is addressed by bitterness.
19
3.2. Bitterness
3.2.1. The Lyon anti-toll manifesto
One of the best descriptions of bitterness can be found by an analysis of the anti-toll road manifesto from Lyon. When translated into economic terms and, setting aside the polemic writing, the complaints were mainly as follows:
lack of information to the population on the cost of the infrastructure and the actual
economic equations involved.
Lack of dialogue with citizens on an urban development project , the catalyst being this
particular infrastructure.
The introduction of the toll reduced the amount of traffic captured by the infrastructure,
so making it less efficient as too many vehicles avoided it by going through the city
centre.
The toll may be socially unfair even if politically (i.e. financially) it is acceptable to
most drivers.
In this manifesto are to be found the ideas which drove J. Rawls’ thinking about fairness, and the investigations we are undertaking with Claude Abraham and Y.Crozer on bitterness (see forthcoming issue of Cahier Scientifique du Transport). The real difficulty is the definition of a method of measurement which is representative of the notion of bitterness and sufficiently widely recognised by the world of decision-makers to be practically applied to any definition of charging structures. We shall separate out two aspects of bitterness, the real bitterness felt by people and its political interpretation by the media and decision makers.
3.2.2. Real bitterness
All of the calculation assumptions for speed (which is the absolutely fundamental parameter), combined with willingness to pay and average distance travelled, make up a measurable and coherent whole. As I have personally spent weeks or months in the cities where these facilities were studied, the calculation of bitterness as set out in the first part of this article on the evidence is a more than satisfactory representation of people’s behaviour, setting aside specific and ephemeral polemic factors. The area contained between the straight line of the charge structure and the demand curve, subject to the nil toll limit, in our view is the best expression in quantified form of people’s behaviour.
Two factors however clearly merit special attention:
The culture of a given country regarding tolls is an essential item if correct interpretation of public reactions are to be made.
Bitterness changes over time, and as and when the concept of tolls is accepted, mentalities in a country’s culture change. The experience of parking fees which are becoming increasingly generalised, is an example of changing cultural factors.
3.2.3. Political interpretation by decision-makers
If it is accepted that bitterness is measurable, the interpretation of the phenomenon by the media and decision makers can be seen sometimes to lead to extreme situations. Toulouse, Lisbon and Lyon are especially good examples of this. Popular discontent, more or less
20
justified according to the circumstance, can be amplified by a media misrepresentation which virtually forces politicians to make decisions which may be irrational in economic terms.
The example of Lyon shows that careful political decision-making and good communication can calm troubled minds and ensure that public opinion debates matters on a reasonable basis. But it is clear that bitterness is a political magnitude. Decisions are not taken in the same way during a period of elections or in the first hundred days after a new political team has been elected. The media sometimes handle their material in such a way as to ensure it resonates with readers’ opinions, and may even create an actual problem were there is none in fact. On the other hand, they may sometimes pour oil on troubled waters if necessary.
A multiplier to the bitterness values is therefore required, to reflect cultural factors and the nearness of elections. At the present time we are convinced that under normal circumstances, an appropriate decision on tolls and charging levels can be made when a multiplier of 1 is applied.
3.3 Logical response: Pareto type optimum
3.3.1. Maximum acceptable charge
In the article published last year in the Transport journal, we suggested that charges should not result in some of those excluded experiencing a negative surplus. The surplus from greater fluidity on the roads themselves is more than offset by the bitterness due to higher charges. In other words, there should be no losers when a toll infrastructure is built, including those who do not actually use it and who feel bitter about it.
If reference is made to the demand curve, it appears that the straight line for the charging level should be below the middle of the segment whose borders are initial disutility and disutility at nil charge. Indeed the highest bitterness occurs at the intersection of the straight line for nil charge disutililty and the demand curve. This bitterness should be less than the reduction in the disutility relating to the charging levels applied, as represented by the distance between the straight line of initial disutility and the line for the selected level of toll or user charge.
We cannot emphasise enough the need for high quality measurement of speed and for the establishment of an O/D matrix to give a reliable outcome to these calculations. We are always very prudent in the use of existing traffic models, which do not give a proper representation of saturation phenomena in urban areas.
3.3.2. Charging system adopted
Setting charges is the main tool of dialogue between political power, people and the licensed operator. The previous quantified case studies showed a few quantified examples of the economic outcome of the construction of a road infrastructure, and of its cost of construction, including finance.
Irrespective of the theories relating to the procedures, principles and justification of toll financing for road construction, the choice of how high to set charges will in the final analysis depend on the political will to allocate the cost of the infrastructure to tax payers and to users charged for using the facility, the tax payers being either national or local. Charging levels
21
will also depend on the specific financial constraints of the local authority which is the commissioner of the infrastructure.
IV. CONCLUSION
To construct or not construct road facility, and how to do it correctly? A political and economical assessment of the appropriateness of a project depends initially on an analysis of the measurable costs and benefits.
4.1. Costs
In this type of infrastructure, cost analysis is appreciably less uncertain than the revenue analysis. Under the contractual processes which are now developing with flat fee contracts and deadlines guaranteed by the construction companies, the cost and time overruns which occurred earlier are kept in check. Indeed, private enterprise takes a higher risk, and to ensure coverage against it, undertakes more in-depth study than when responding to a classic invitation to tender.
4.2. Benefits
Until the present time, it was difficult to make an assessment of benefits, not only in regard to the uncertainties as to future traffic levels, but also in terms of the value placed on time spent in transport, and of the political reactions engendered. With a demand curve on the one hand, and the concept of bitterness on the other, we finally have the elements with which to make a calculation of benefits discounted to present day values, which also take into account political factors, with some degree of similitude.
4.3. Discountrates
Whether a project is undertaken by the authorities or a private enterprise, the financial interest of any investment is measured by discounting future cash flows to present day values. To be taken into account here are social and economic benefits for the local authorities, and dividends for private enterprise, although both entities will be exposed to the cost of infrastructure construction. In transportation projects, the commercial operators will seek rates of return between 10 and 20 % according to the circumstances. In the public field, the usual values were until recently from 6 to 8%.
But in the last few years, central government thinking has changed, and short term pressures have become far stronger. This means that paradoxically, the discount rates which underlie decisions taken by governments in investment fields are now closer to 20-25%! This is a perfect justification for moving to public/private partnerships, which are now increasingly encountered.
With an improved method of calculation of benefits, as we have shown above, appropriate charging levels, and a realistic choice of the discount rate, the authorities may finally have the necessary tools to make appropriate choices in terms of toll charging policy and project finance.